Trade with Russia decreased during 2022

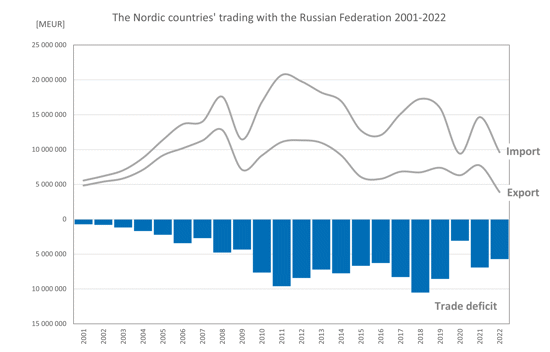
The Nordic region’s trade with Russia has varied over the past twenty years but has always resulted in a trade deficit. In 2022, a possible shift in trade values can be seen. Both import and export decreased, although the trade deficit remained.
The Nordic region’s total trade values have increased during the last twenty years. Both the import to and the export from the Nordic region have increased, and the export has exceeded the import resulting in a trade surplus during all years. In the past five years a lot has happened that can affect the possibilities of trade, most recently Russia’s invasion of Ukraine. This is an analysis of the effects of that invasion on Nordic trade with the Russian Federation.
Trade with Russia has been strongly affected following Russia's invasion of Ukraine, with the EU and others imposing import and export restrictions on several products. Compared with 2021, Nordic imports (1) from Russia were down by 34 percent and Nordic exports to Russia by 50 percent, illustrated in Figure 1. The size of the trade balance (the value of exports minus the value of imports) was down 17 percent in 2022 compared to 2021, amounting to around 5.7 billion Euro.
Fluctuations in trade balance over time is relatively normal, but a decrease of this magnitude in both export and import from one year to another is less common. Exports to Russia in 2022 were the lowest recorded in 20 years, while imports were at the same low level as in the height of the pandemic in 2020. Apart from this, we must go back 15 years to see 2022 levels in imports.
Of all trade with countries outside the Nordic region, imports from Russia accounted for 4 percent of the total value in 2021 and dropped to 2 percent in 2022. The value of exports to Russia similarly decreased, from 2 percent in 2021 to 1 percent in 2022.
The figures below show the trade values between the Nordic countries and Russia in 2022: Imports, exports and balance of trade. Finland has the largest flows of import and export, which is expected considering Finland’s geographic location. Sweden has the second largest export to Russia while Norway has the second largest import. For Greenland and Åland there are no values available for 2022, but considering historical values these would not change the figure significantly.
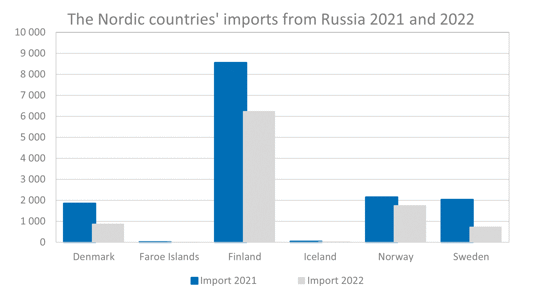
Compared with 2021 imports were down for all countries, with drops varying between 64 percent in Sweden and 10 percent in Faroe Islands. The total value of all imports from Russia in 2022 was 9.6 billion, which is a decrease by 34 percent compared to 2021.
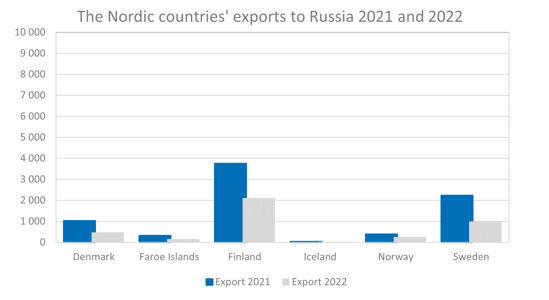
Exports were similarly down, with drops varying between 93 percent in Iceland and 39 percent in Norway. The total value of Nordic exports to Russia in 2022 was 3.9 billion, a decrease by 50 percent compared to the previous year.
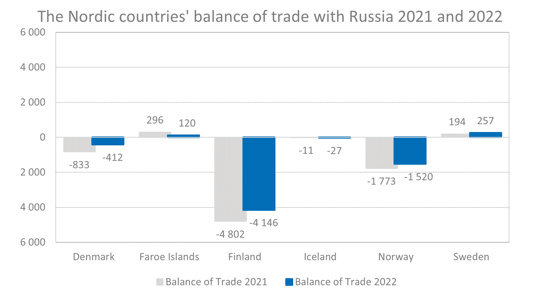
Altogether, the Nordic trade balance with the Russian Federation decreased by 17 percent, or a combined value of 1.2 billion, between 2021 and 2022.
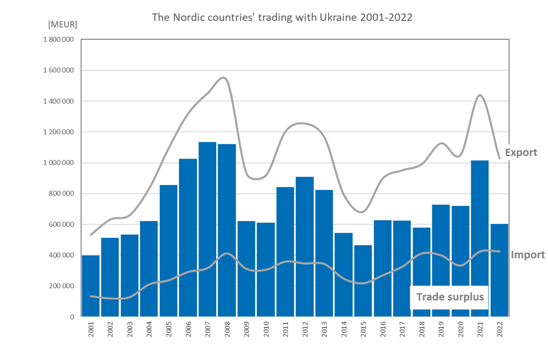
Has the invasion affected the trade with Ukraine?
The trade values between the Nordic region and Ukraine are lower than those with Russia, in terms of economic value about a tenth. In 2022, a total of 1 billion Euro worth of goods were exported to Ukraine and just over 0.4 billion worth were imported from Ukraine. Compared with previous years these are relatively normal figures. There is a drop in export value to Ukraine compared to the previous year, but the 2022 value was unusually high so it is hard to say if this is a drop caused by the war or a return to normal values. The invasion may have affected the willingness of other countries to import from Ukraine positively, but it has also strongly affected the possibilities for Ukraine to deliver goods abroad.
(1) Please note that for 2022 there are no values available for Greenland or Åland. Greenland is therefore excluded from the Nordic total this year As Greenland normally contribute less than one percent of the total Nordic export and import with Russia this does not affect the analysis significantly. Åland are included in the values for Finland and hence also in the Nordic values for 2022.