Strong public finances in the Nordics compared to EU average

Two out of four Nordic countries had a fiscal surplus in 2024 and all but one had stronger public balances compared to the EU average. The largest public balance surplus 2024 is seen in Norway, which is related to the country’s export of oil and natural gas. In terms of gross debt, which is the total debt accumulated by all levels of government, we observe a similar pattern where three out of four countries had a lower debt compared to the EU average.
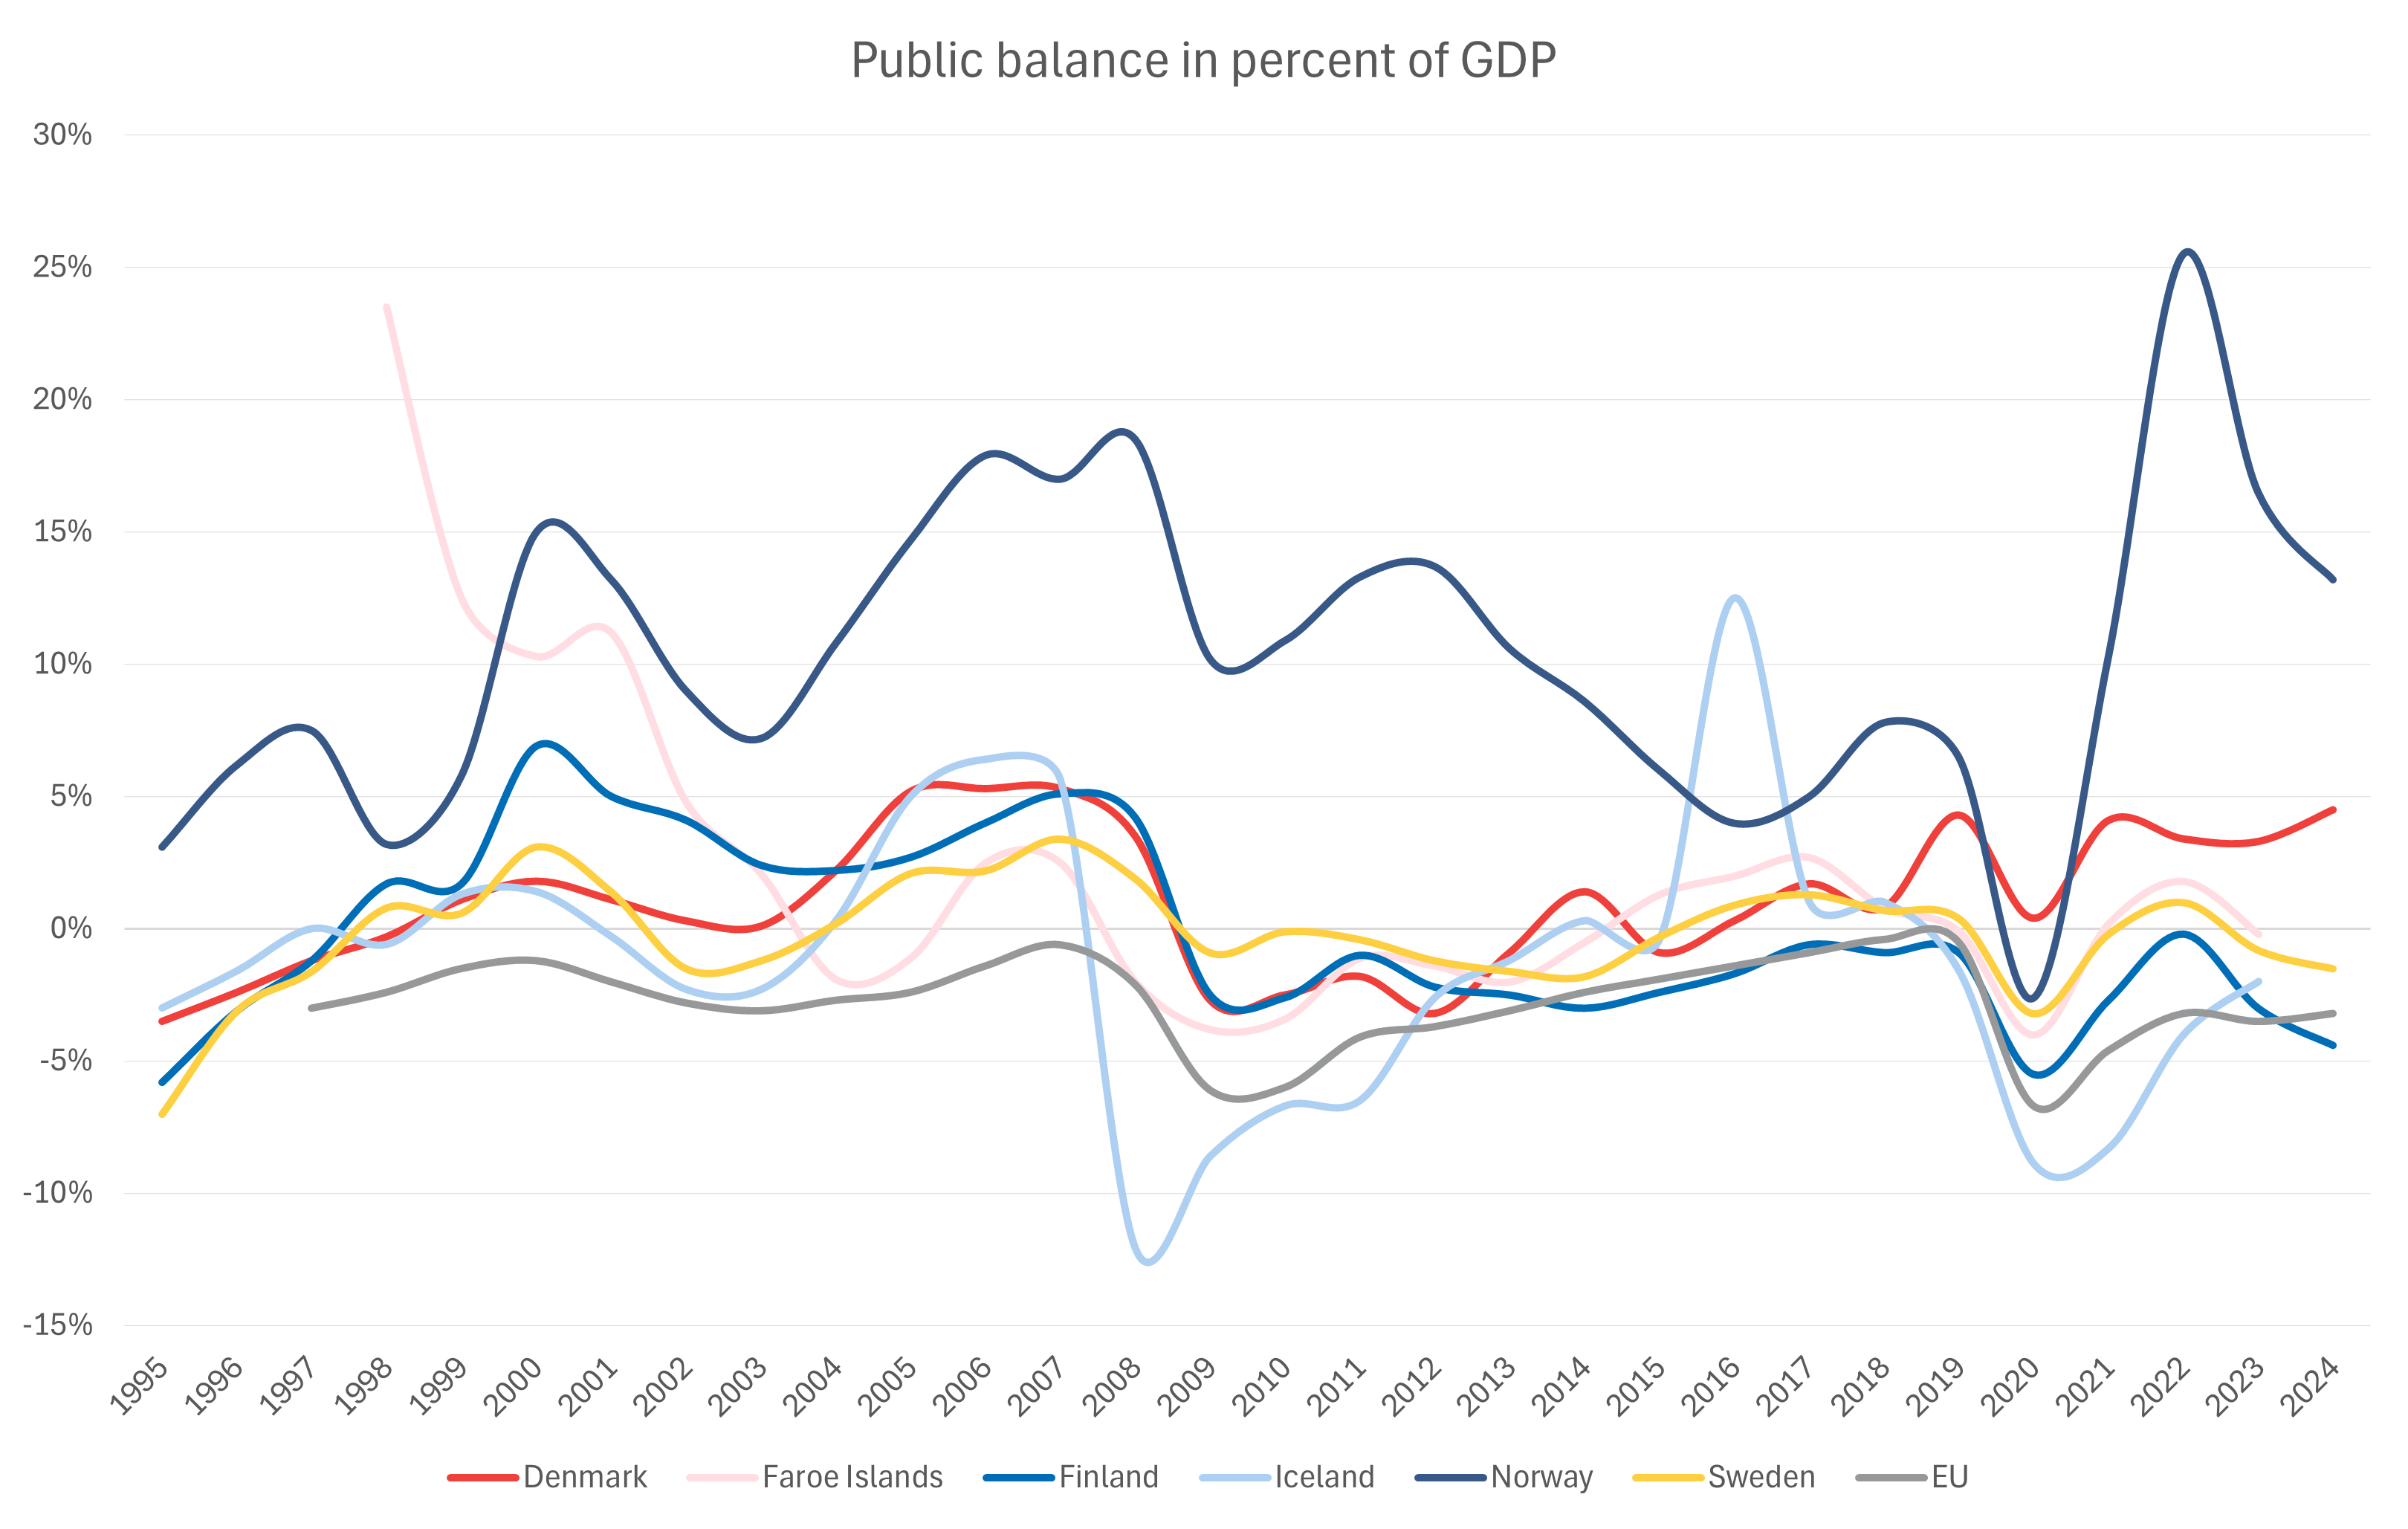
Public balance indicates whether a government has a budget surplus or deficit within a specific time period, for example a calendar year. The measurement is sometimes referred to as net borrowing/lending. Negative values - net borrowing - implies that there is a deficit which occurs when government expenditures exceed revenues. The government must borrow money to cover the deficit, for example by issuing bonds. Positive values - net lending - occurs when total government revenue exceeds the total expenditure resulting in a surplus. The indicator is often expressed in terms of percentage of GDP, as in the graph below, to enable comparisons.
Source: Nordic statistics database, PUBS14
Comparing the public balance among the Nordic countries, it is evident that Norway has had the largest surplus for most of the past 30 years. We can also observe the largest fluctuations in Norway, ranging from -2.6% to 25.5% within two years of the pandemic.
Relatively large fluctuations can be observed for Iceland as well. The balance went from 5.6% to -12.1% between 2007 and 2008 when the global financial crisis hit. In most of the other Nordic countries, the effects of the financial crisis on public balance were first seen in 2009. Another synchronized turn-down was seen in the first pandemic year of 2020 when the EU and all Nordic countries except Denmark displayed deficits in public balance.
Interestingly, the EU average has displayed a deficit every year since 1997. A similar pattern can be seen for Finland, which has displayed a deficit every year since 2009.
In 2024, Norway is still at the largest surplus followed by Denmark. Sweden, Finland, and the EU displays a deficit whereas data is still pending for Iceland and the Faroe Islands. For the countries that have reported data for 2024, only Finland had a larger deficit than the EU average.
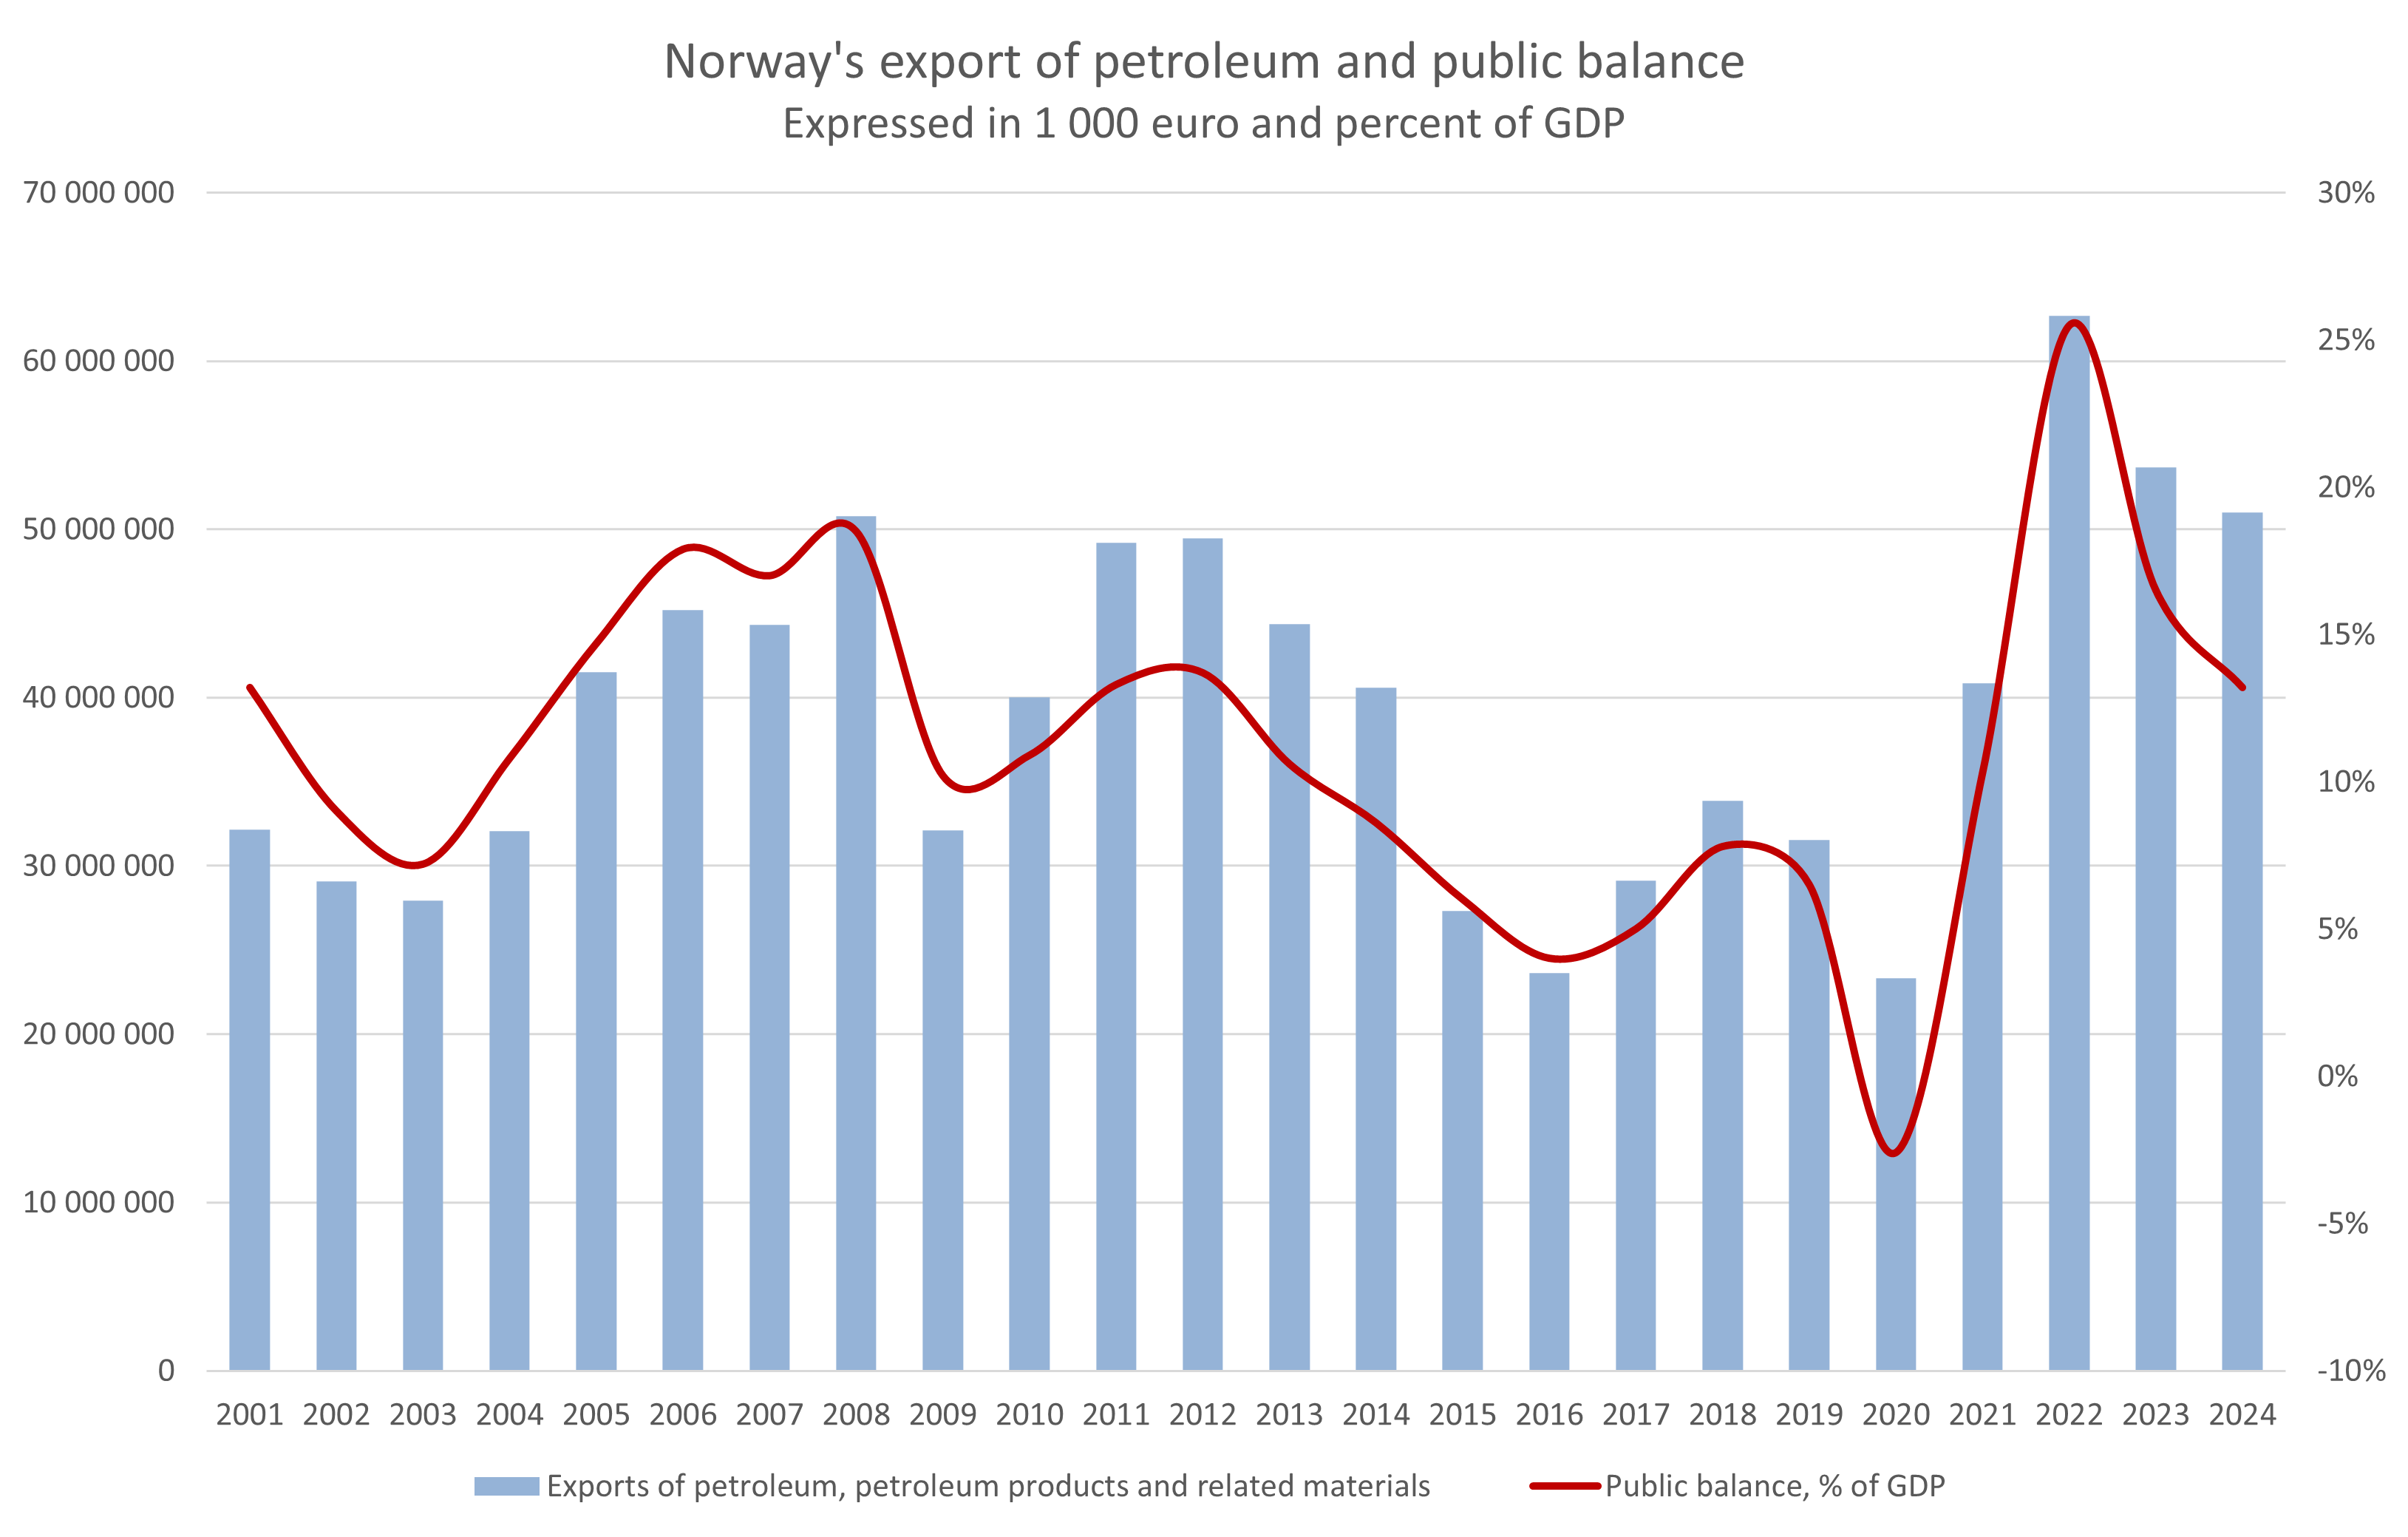
In Norway, the fluctuation in public balance is highly connected to the petroleum sector and exports of oil and natural gas. In the figure below, Norway’s exports of petroleum products are displayed in 1 000 euros together with the country’s public balance. The fluctuations in exports and public balance displays a similar pattern. When the export value of petroleum products increases or decreases, the public balance tends to follow. This can especially be seen during the peak of 2022, when Russia’s invasion of Ukraine led to high prices on natural gas which Norway exported to higher revenues [1]. These additional revenues are subsequently reflected in the public balance.
Source: Nordic statistics database, PUBS14 and FOTR46
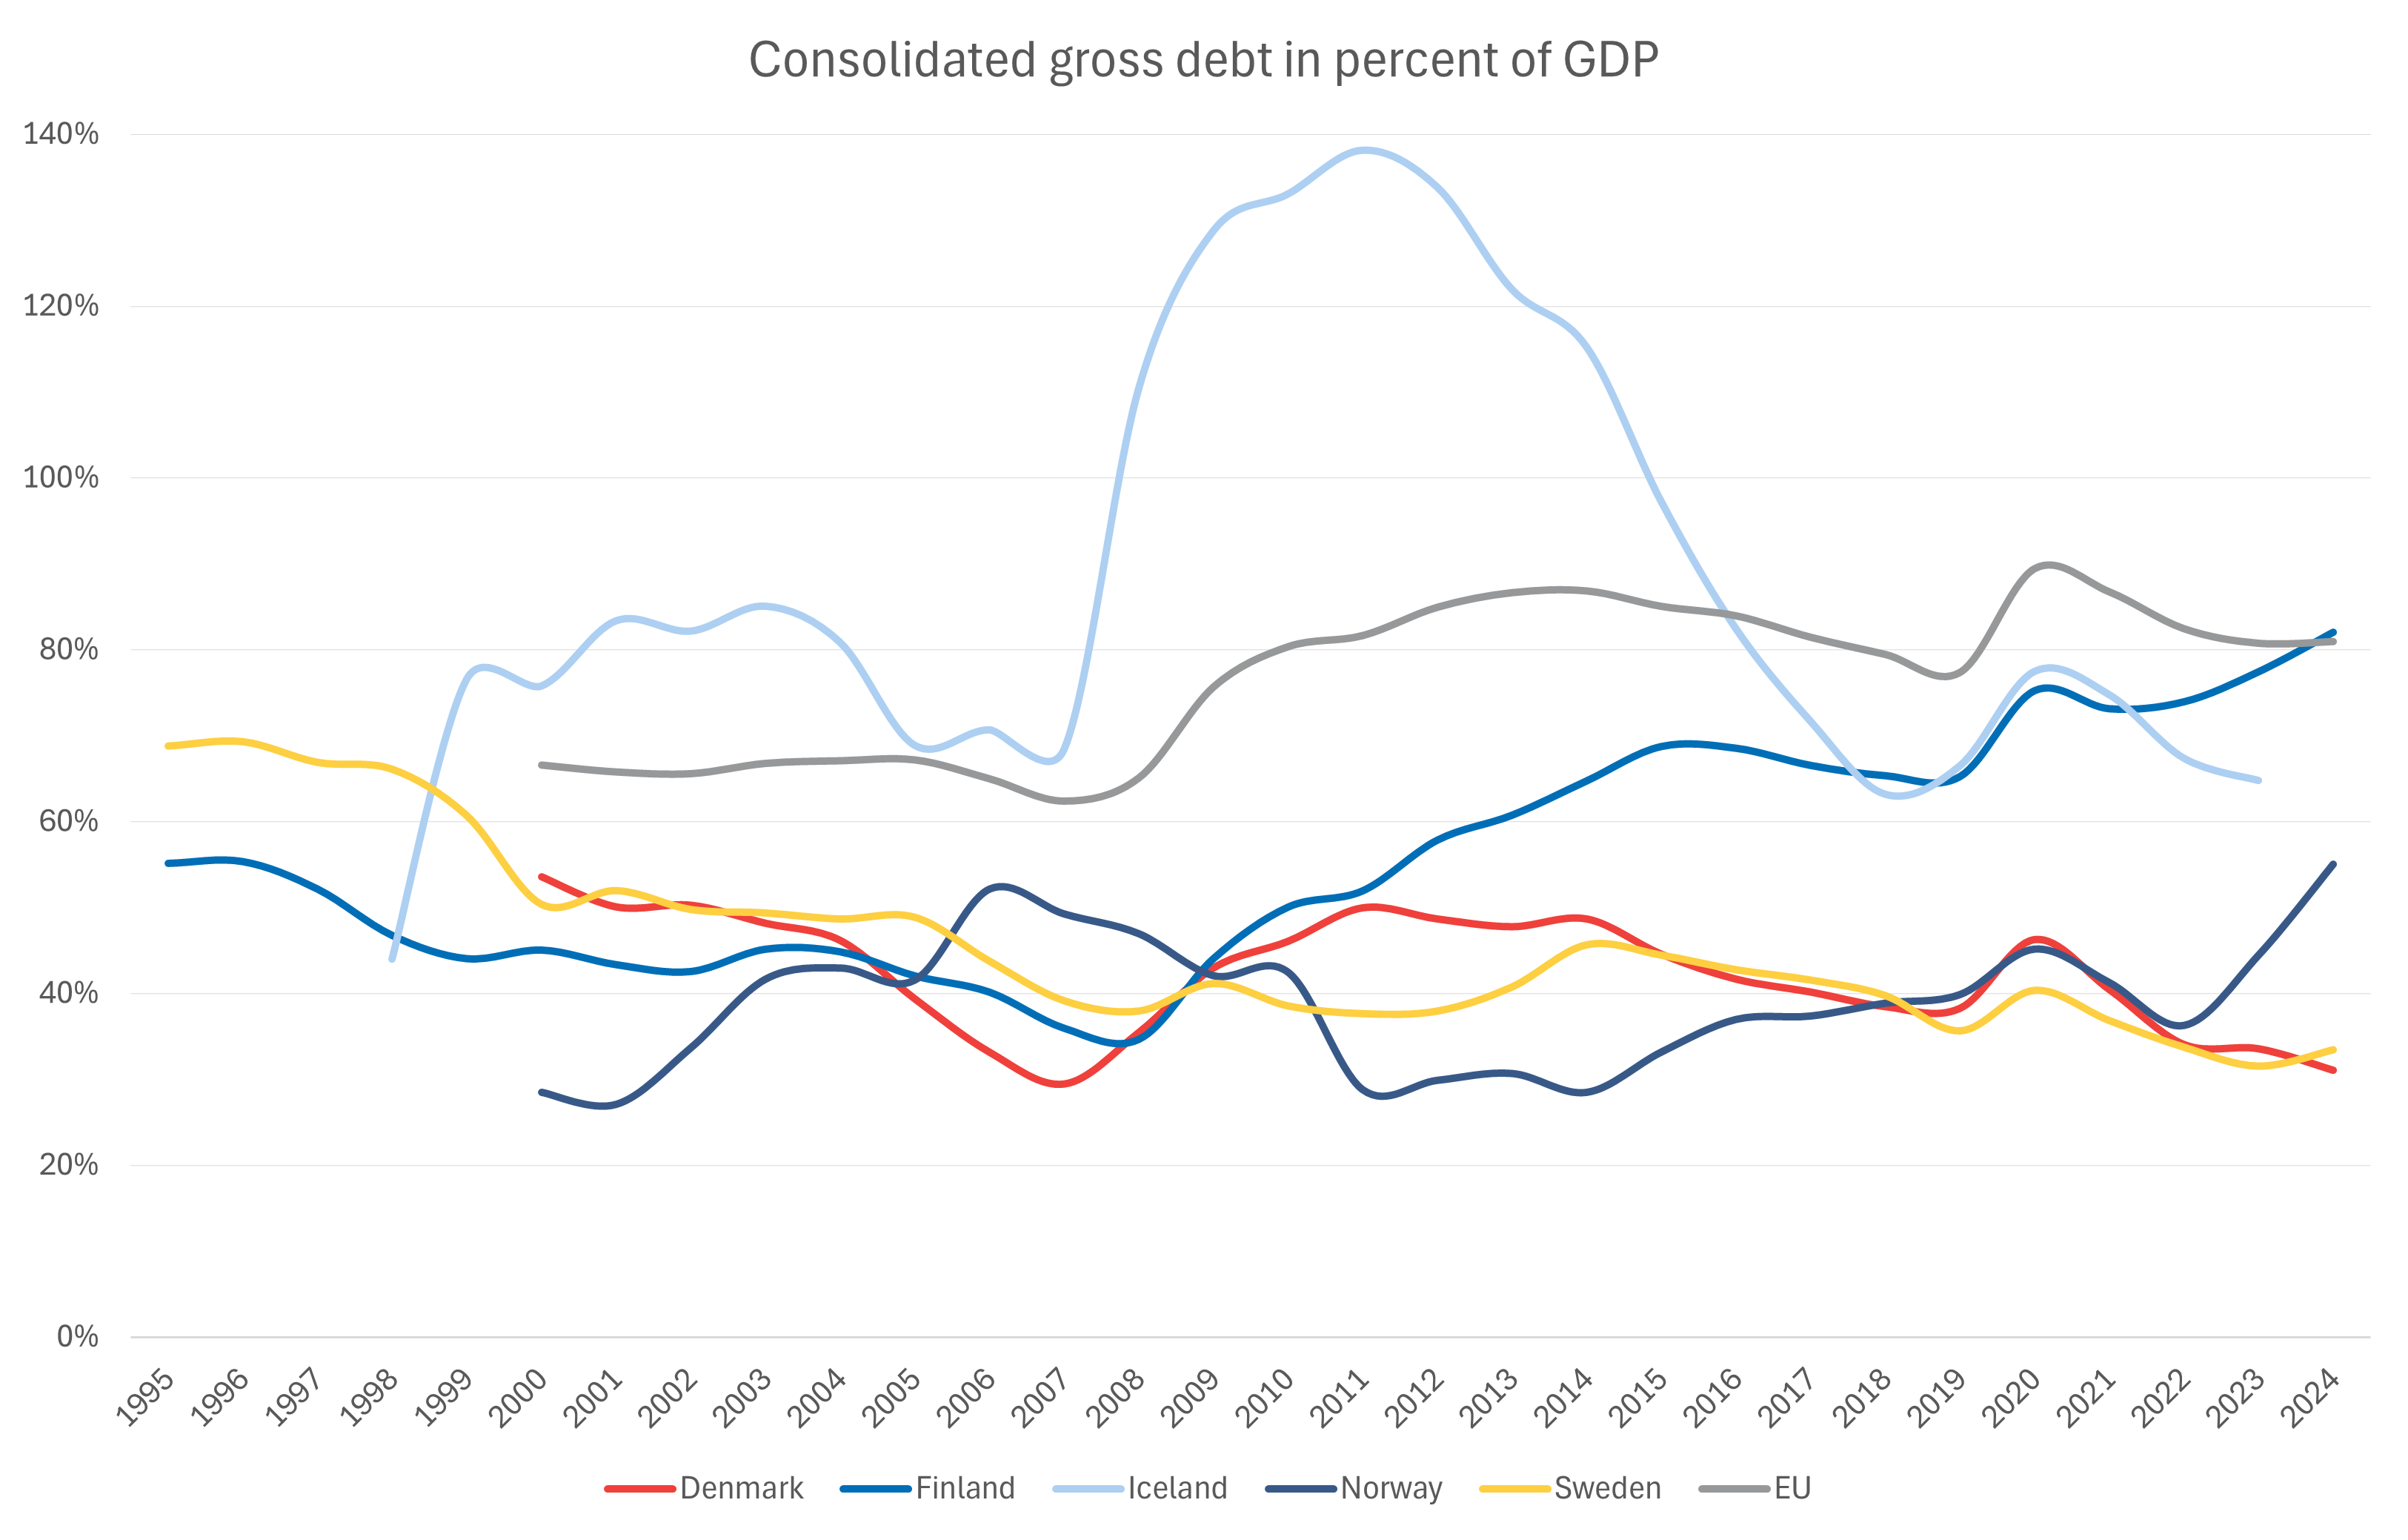
Another common measurement within public finance is consolidated gross debt, which reflects the total debt accumulated by all levels of government. Consolidated means that internal debt has been accounted for. In other words, the owed debt between the different government sectors have been excluded (central government, state government, local government, and social security funds). This means that only debt that is being owed externally is included, for example debt to the private sector and abroad.
Source: Nordic statistics database, PUBS14
Examining the consolidated gross debt among the Nordic countries, the severe effects of the financial crisis in Iceland becomes evident once again. At its peak in 2011, Iceland had a consolidated gross debt amounting to 138% of GDP. A successful economic recovery followed and Iceland’s debt relative to GDP was lower than both Finland and the EU average by 2018.
In recent years, all Nordic countries have had a lower debt than the EU average, up until 2024 when Finland surpassed the EU. As observed in the figure on public balance, Finland has had a deficit (net borrowing) every year since the financial crisis of 2009. This is in line with the development of the consolidated gross debt in Finland, which has increased from 35% of GDP in 2008 to 82% in 2024.
In summary, Norway consistently demonstrates strong fiscal performance, largely driven by petroleum exports. In contrast, Finland has struggled with persistent deficits since the financial crisis, reflected in its growing consolidated gross debt, surpassing the EU average in 2024. Overall, the Nordic countries exhibit healthier public finances than the EU, despite considerable fluctuations tied to global economic events.