Nordic GDP growth returns to pre-pandemic levels

The Nordic countries have successfully bounced back from the pandemic, with their GDP reaching pre-pandemic levels. In 2022, GDP growth ranged from 2.1% in Finland to 6.4% in Iceland compared to the previous year, and 2.7% (Finland) to 6.5% (Denmark) compared to the levels in 2019. While four countries followed similar trajectories, Iceland stood out slightly.
Since 1995, the real GDP of the Nordic countries has experienced growth between 56% (Denmark) and 133% (Iceland). For comparison, the European Unions (EUs) GDP grew by 55% during the same period. However, there have been fluctuations throughout this period. GDP measures the value of goods and services produced within a country and is calculated quarterly or annually. Chained linked volumes, which account for price changes, are used to show the volume change in GDP.
The Nordic economy
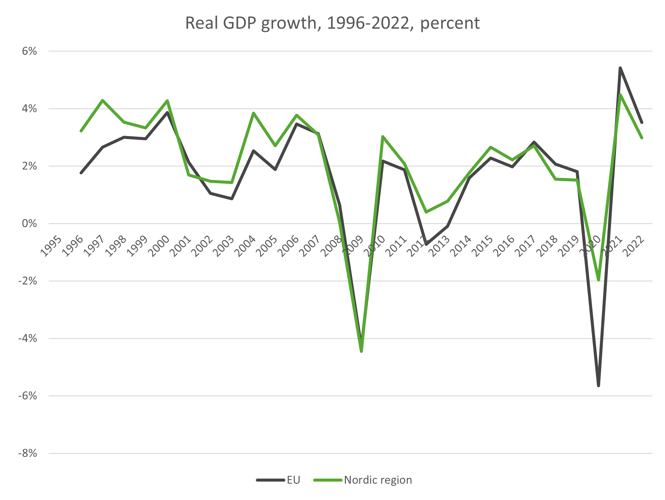
In the mid-1990s, the Nordic economies enjoyed stable GDP growth of around 4% annually. However, this changed in the early 2000s due to the dot-com crash of 2000 and the September 11, 2001 terrorist attacks. The GDP growth rate dropped and was around 1.5% between 2001 and 2003.
Following the relatively mild recession in the early 2000s, the global financial crisis erupted in 2007-2008. This crisis, the worst since the Great Depression, was triggered by the collapse of the American property market and the subsequent collapse of banks. The Nordic economies and the EU experienced a significant decrease in GDP in 2009, with the combined Nordic GDP declining by -4.5% and the EUs by -4.3%.
Following the global financial crisis, the Nordic economies experienced a rapid recovery in 2010. However, the deepening debt crisis in the euro area caused a slowdown. From 2014 to 2019, the Nordic GDP growth then remained stable, averaging 2.1% annually and matching the EU average.
The COVID-19 pandemic in 2020 led to a new recession globally. The Nordic GDP decreased by -2.0%, which was less severe compared to the EU where the decrease was -5.6%. However, both regions experienced a rebound in activity in 2021 and have seen further expansion in 2022.
Source: Nordic Statistics Database, NAAC01: National accounts, supply and demand, million euro by reporting country, national accounts indicator, unit and time
Overall, the Nordics have faced various challenges and disruptions to their economies in recent years but have managed to recover from setbacks, aligning with the broader trends in the EU.
Iceland’s path stands out
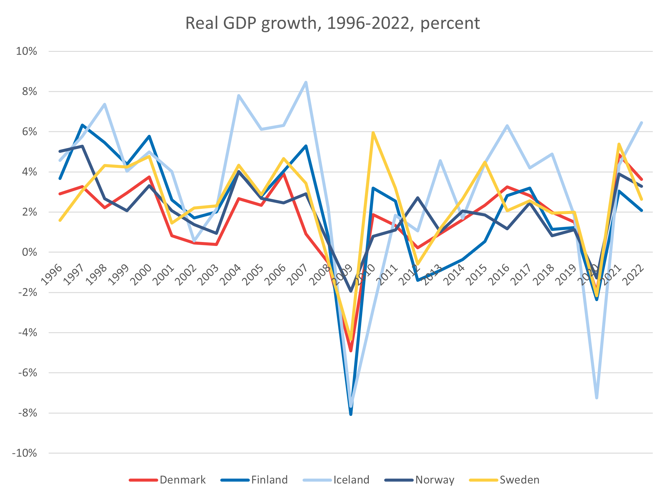
In the Nordic countries, economic development has generally followed a similar trajectory, except for in Iceland. During the early 2000s crisis, Iceland experienced a delayed drop in growth and an earlier recovery, resulting in a shorter recession. In the 2009 crisis, Iceland faced one of the largest declines in growth, with a -8.1% decrease. They then had further -2.8% decline in 2010, while the other Nordic countries had positive growth.
In the 2020 COVID-19 recession, Iceland also suffered a significantly larger decline than the other Nordic countries, -7.2% compared to an average of -1.9% for the other four. 2021 was then a year of recovery and relatively high growth for all five countries, but in 2022, growth rates slowed down again, for all except Iceland. They saw an additional increase of 2.1 percentage points. The other four countries experienced decreases in growth rates ranging from 0.6 to 2.7 percentage points.
In summary, all five countries have returned to pre-pandemic levels, but Iceland's economic path has been distinct, with a shorter recession in the early 2000s, larger declines in the 2009 and 2020 crises, and stronger growth in 2022 compared to the other Nordic countries.
Source: Nordic Statistics Database, NAAC01: National accounts, supply and demand, million euro by reporting country, national accounts indicator, unit and time
Strong Average Annual GDP Growth in the Nordic Region
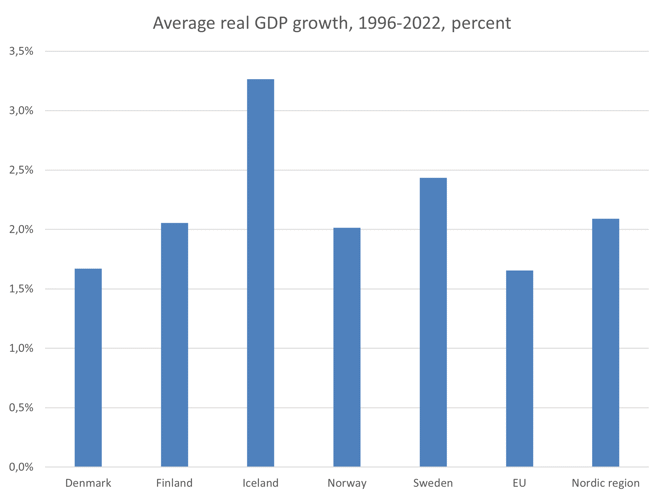
From 1996 to 2022, the Nordic region has consistently outperformed the EU in terms of average annual growth in real GDP. With a rate of 2.1%, the Nordic countries surpassed the EU's rate of 1.7%.
Iceland, despite experiencing significant ups and downs, achieved the highest average growth rate in the group at 3.3%. Sweden followed closely with the second largest growth rate of 2.4%, while Finland and Norway were tied at 2.1% and 2.0% respectively. Denmark had the lowest average growth rate among the Nordic countries, standing at 1.7%.
Source: Nordic Statistics Database, NAAC01: National accounts, supply and demand, million euro by reporting country, national accounts indicator, unit and time
Recent development
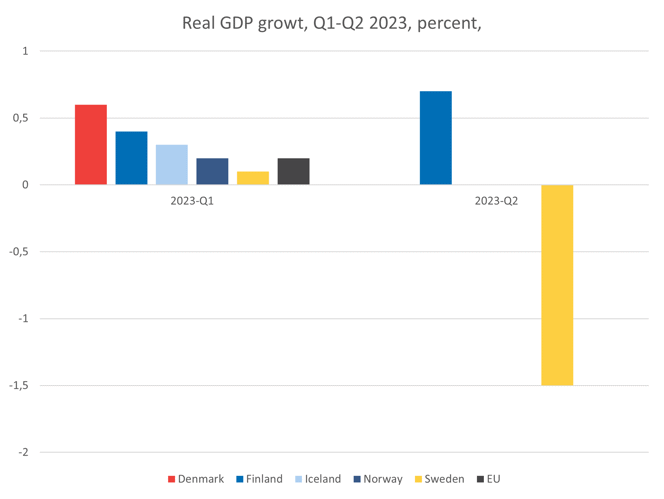
In Q1 2023, all five of the larger Nordic countries reported positive GDP growth, ranging from 0.1% in Sweden to 0.6% in Denmark. The EU's GDP grew by 0.2% during the same period. Only two Nordic countries have released Q2 data for 2023, Finland and Sweden. Finland reports a (provisional) 0.7% rise in Q2, following a 0.4% rise in Q1. Sweden reports a modest 0.1% rise in Q1 and a -1.5%. decline in Q2. The EU's GDP remained unchanged during the same period.
In the coming months, quarterly key figures will also be made available in the Nordic Statistics Database. GDP is a key indicator of economic development, and quarterly data provides information that is more up to date than annual figures, which is important in volatile times.
Source: EUROSTAT, NAMQ_10_GDP, GDP and main components (output, expenditure and income) (DK, FI, NO, SE and EU)
EUROSTAT, NAMQ_10_GDP, GDP and main components (output, expenditure and income) (IS)
Iceland: Please note that quarterly data differs, it is seasonally adjusted but not calendar adjusted. Other countries are adjusted both ways.