Mobility in the Nordic region IV – Industries and development over time

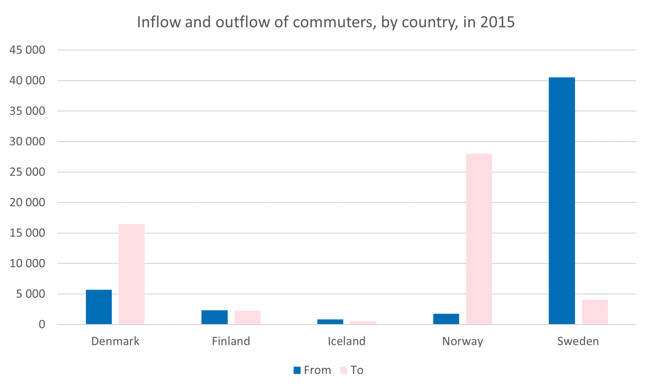
At the end of 2015 a total of 51,234 Nordic residents commuted to a job in another Nordic country than they were residing in. One in four of these commuted to a job in the transport sector. Other business services, Construction, Human health and social work and Manufacturing, mining and quarrying and utility services were the other four largest sectors, all attracting over ten percent of the commuters, respectively. The flow of commuters across the Nordic borders seems, however, to be declining.
Commuting at the Nordic level is dominated by the flow of commuters from Sweden to Norway and Denmark, which accounted for 75 percent of all the commuting in the Nordic area in 2015.
Source: Nordic statistics database, COMM11 Cross-border commuters by type of municipality, region of residence, industry, time and country of work.
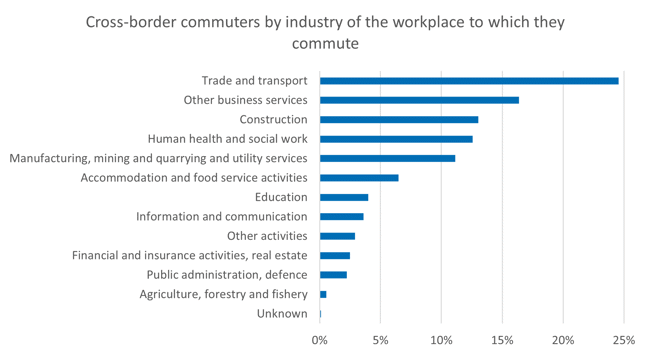
A lot of the variation in the flow of commuters between the Nordic countries can be explained by the labour market situation in the respective countries; but also by the difference in industrial structures. In the chart below all Nordic cross-border commuters are distributed by the industry of the workplace to which they commute. The industry is according to the NACE classification.
Source: Nordic statistics database, COMM11 Cross-border commuters by type of municipality, region of residence, industry, time and country of work.
Commuting to a job in Trade and transport is most common, one in every four cross-border commuters does so. The group Other business services is the second largest, covering among other things temporary employment agencies. It can be convenient to use this as a gate to jobs in a foreign country. Construction, Human health and social work and Manufacturing, mining and quarrying and utility services are three other large sectors that attract between 11 and 16 percent of the commuters each.
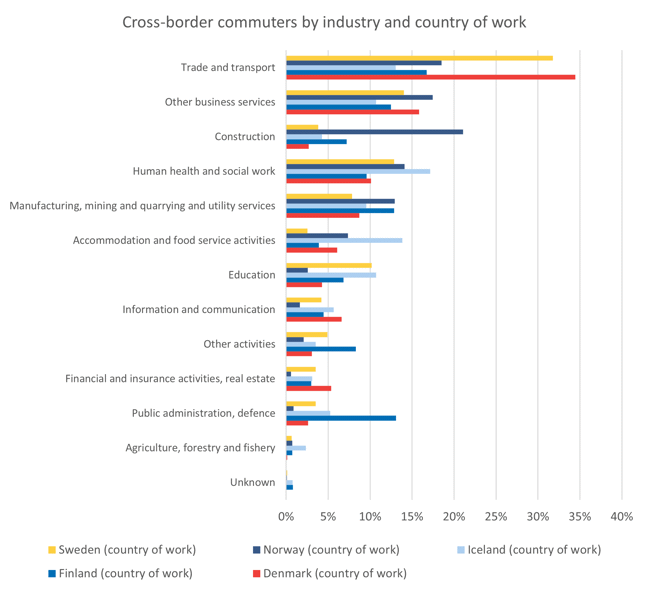
But just as the size of the flows differs between the countries, the sectors that commuters work in also does.
Source: Nordic statistics database, COMM11 Cross-border commuters by type of municipality, region of residence, industry, time and country of work.
Although very different in size of inflow of commuters, Sweden and Denmark have similar patterns in sectors. More than 30 percent of commuters to both countries worked in Trade and transport. For commuters to the other countries this sector had a high share of jobs as well, but not as dominating as for Denmark and Sweden. The second most common sector in both countries was Other business services, followed by Human health and social work.
In Norway the most common sector was Construction, with just over one fifth of the commuters. Trade and transport and Other business services came in a close second with 19 and 17 percent, respectively.
The largest industry of work in Iceland was Human health and social work with 17 percent of the commuters. In second place came Accommodation and food service activities with 14 percent, a sector that was much smaller in the other countries. Trade and transport came in third place with 13 percent.
Finland also had Trade and transport as the largest sector, with 17 percent of the commuters, but the sectors in second and third place stood out. Public administration and Manufacturing, mining and quarrying and utility services both drew 13 percent of the commuters, sectors that were much smaller in the other countries.
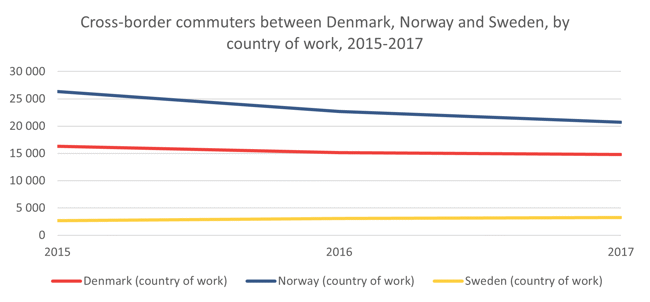
Three countries, Denmark, Norway and Sweden, have made data for three years available (for more information about the exchange of data, please see the project report). Since the flow between these three account for around 75 percent of the total cross-border commuting in the Nordic region, this data can be said to be representative of the flows in large.
In 2015 a total of 45 300 people cross-border commuted between the three countries. In 2017, that number was down to 38 800. It is the flow to Norway that has declined most, from 26 300 in 2015 to 20 700 in 2017. The flow to Denmark has also declined, from 16 300 to 14 800, while the flow to Sweden has increased slightly from 2 700 to 3 300. Whether this is natural variation, or a downward trend is difficult to say, for that more data is needed.
Source: Nordic statistics database, COMM11 Cross-border commuters by type of municipality, region of residence, industry, time and country of work.
For more information, please see the full project report here: https://www.norden.org/en/publication/nordic-cross-border-statistics.