Join us in celebrating International Day of Democracy!

In 2007 the United Nations General Assembly decided to observe September 15 as the International Day of Democracy—with the purpose of promoting and upholding the principles of democracy. Democracy means government by the people or people's power. A fundamental idea behind democracy is that the citizens or residents in a country should have the opportunity to exercise political influence, for example, by means of regular elections. Another fundamental idea behind democracy is that all human beings are of equal value and should enjoy the same rights. So, how are we doing in the Nordics?
The Nordic countries have a long tradition of democracy and extensive gender equality. The region has high election turnout and the proportions of women in the Nordic parliaments are among the highest in the world. In Vision 2030, however, the Nordic Council of Ministers states that in order to be the most sustainable and integrated region in the world in 2030, where democracy is a fundamental factor, development must continue in the right direction. Voter turnout and the percentage of women in national parliaments are two indicators chosen to measure whether this is the case.
High election turnout
Although the Nordic average voting age population (VAP) turnout has varied since the 1990s it remained in the 75-80 percentage span during the whole period. This is high compared to the global average. During the last ten-year period, a negative trend can however be seen for all Nordic countries. The reason is not clear, but some countries report that turnout seems to be influenced by resources and social context and that it above all falls in groups that already voted to a lesser extent in the past.[1]
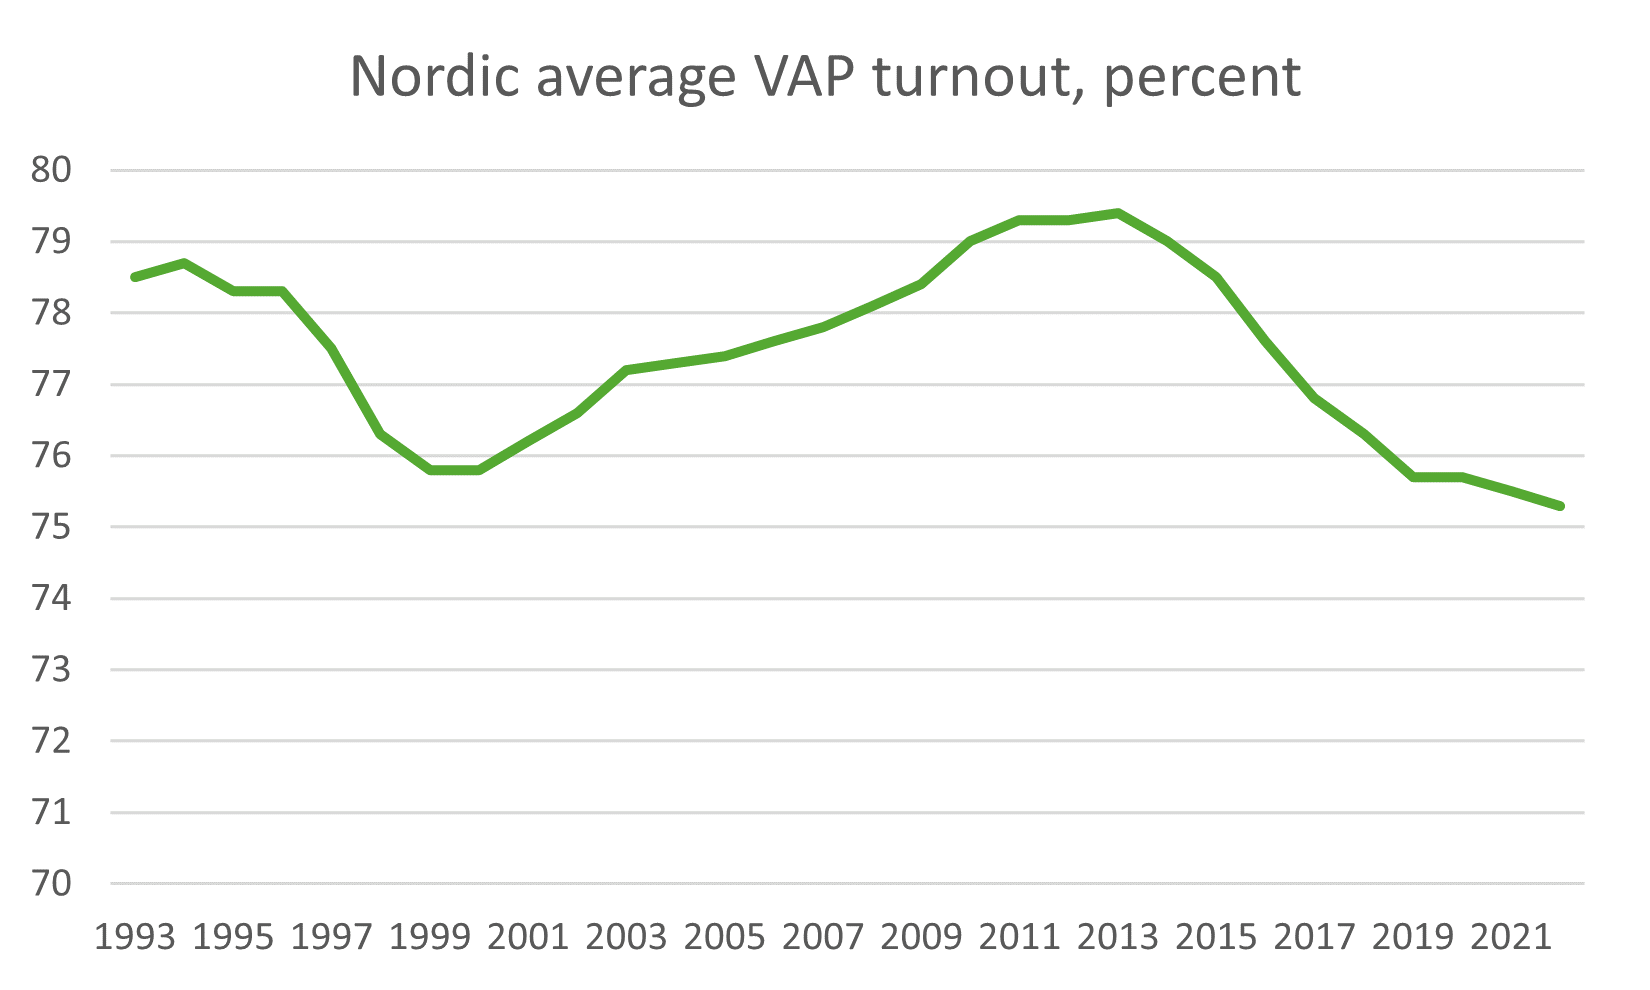
Source: Nordic Statistics Database, SOSU42: Voter turnout by time and reporting country
According to the International Institute for Democracy and Electoral Assistance, IDEA, global voter turnout was fairly stable between the 1940s and the 1980s, falling only slightly from 78 percent to 76 percent over the entire period. It then fell sharply in the 1990s, to 70 percent, and continued its decline to reach 66 percent in the period of 2011–15.
In Europe, the region which experienced the highest level of voter turnout between the 1940s and the 1980s, voter turnout has decreased significantly since the 1990s. In 2011-2015 the European level was the same as the global average, approximately 65 percent. The decline in Europe is more significant than the decline in the other regions [2]. The same pattern cannot be seen for the Nordic region.
Even though election turnout in the Nordic countries thus is well above the global average, it varies throughout the region. In the most recent national parliamentary election voter turnout was between 61 percent in Åland and 87 percent in Faroe Islands.
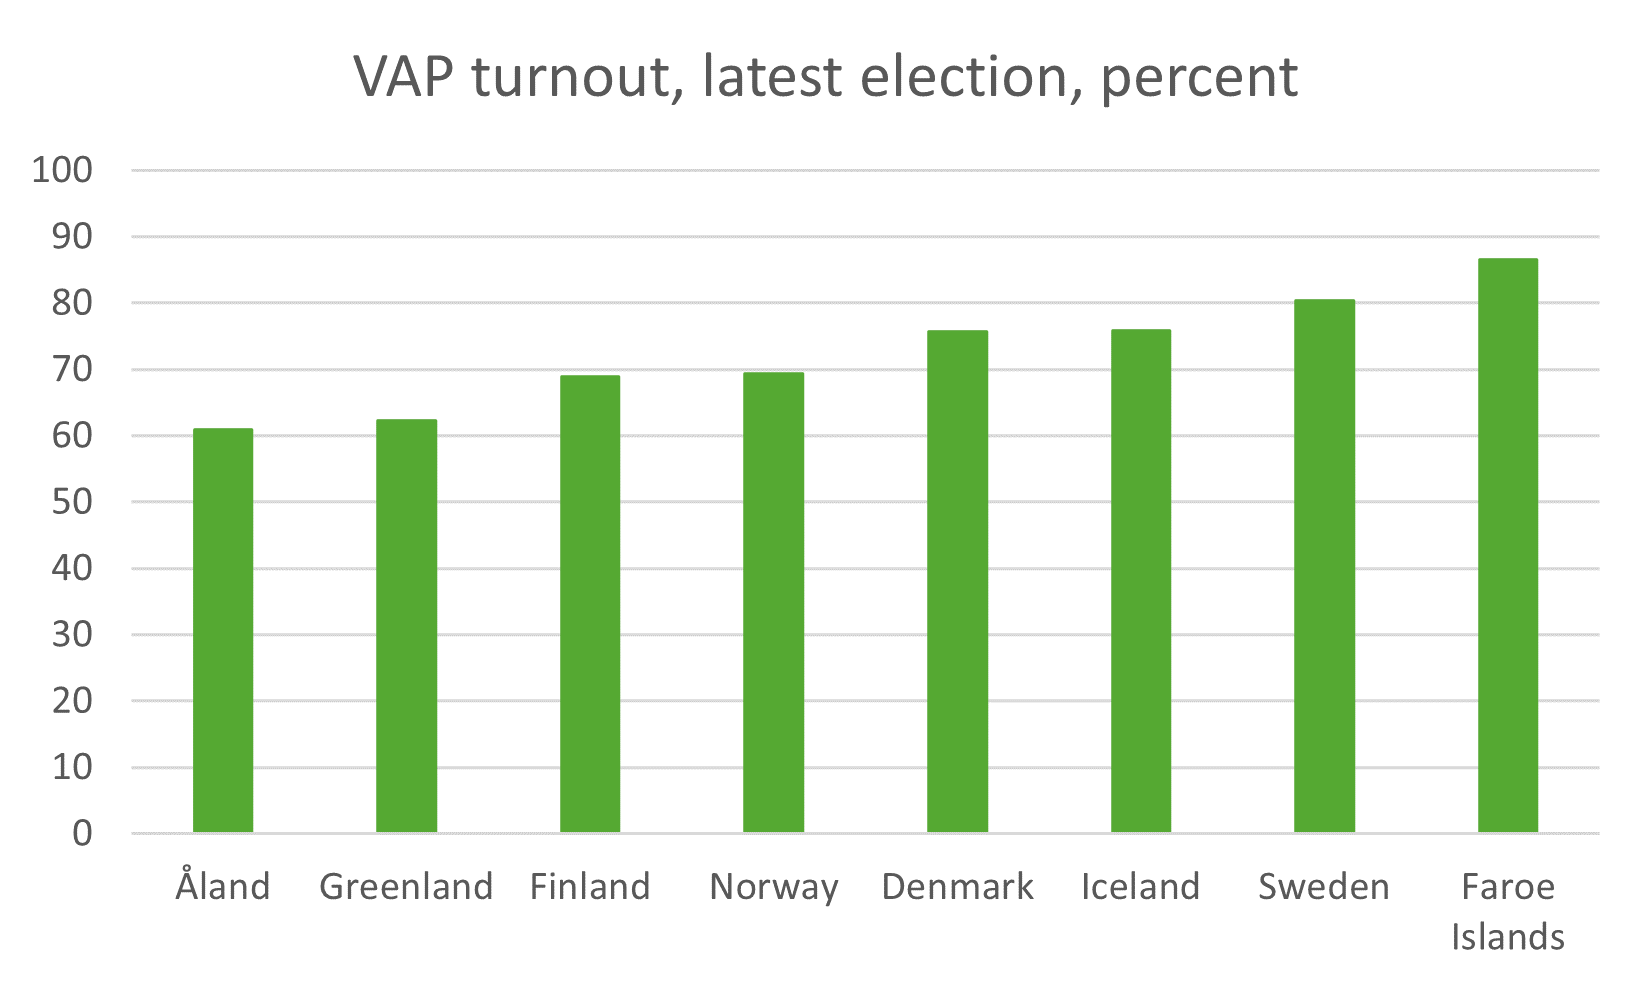
Source: Nordic Statistics Database, SOSU42: Voter turnout by time and reporting country
Voting age population turnout is calculated as the total number of votes cast (valid or invalid) divided by the Voting Age Population (VAP), which includes all citizens above the legal voting age.
Nordic parliaments lead with 45% women, surpassing EU average
The proportion of women in the Nordic parliaments is one of the highest in the world, however still below 50 percent. In 2022, the Nordic average was 45 percent women, to be compared with 33 percent in the EU as a whole. Worth noticing is that the difference is decreasing as the EU average has increased quicker than the Nordic average during the past 20 years.

Source: Nordic Statistics Database, SOSU23: Female members of parliament by time and reporting country
The share of female members of parliament also varies between the Nordic countries. When comparing the latest observations, from 2022 for all except Greenland (2020) the share ranges from 30 percent in Åland and Faroe Islands to 48 percent in Iceland.
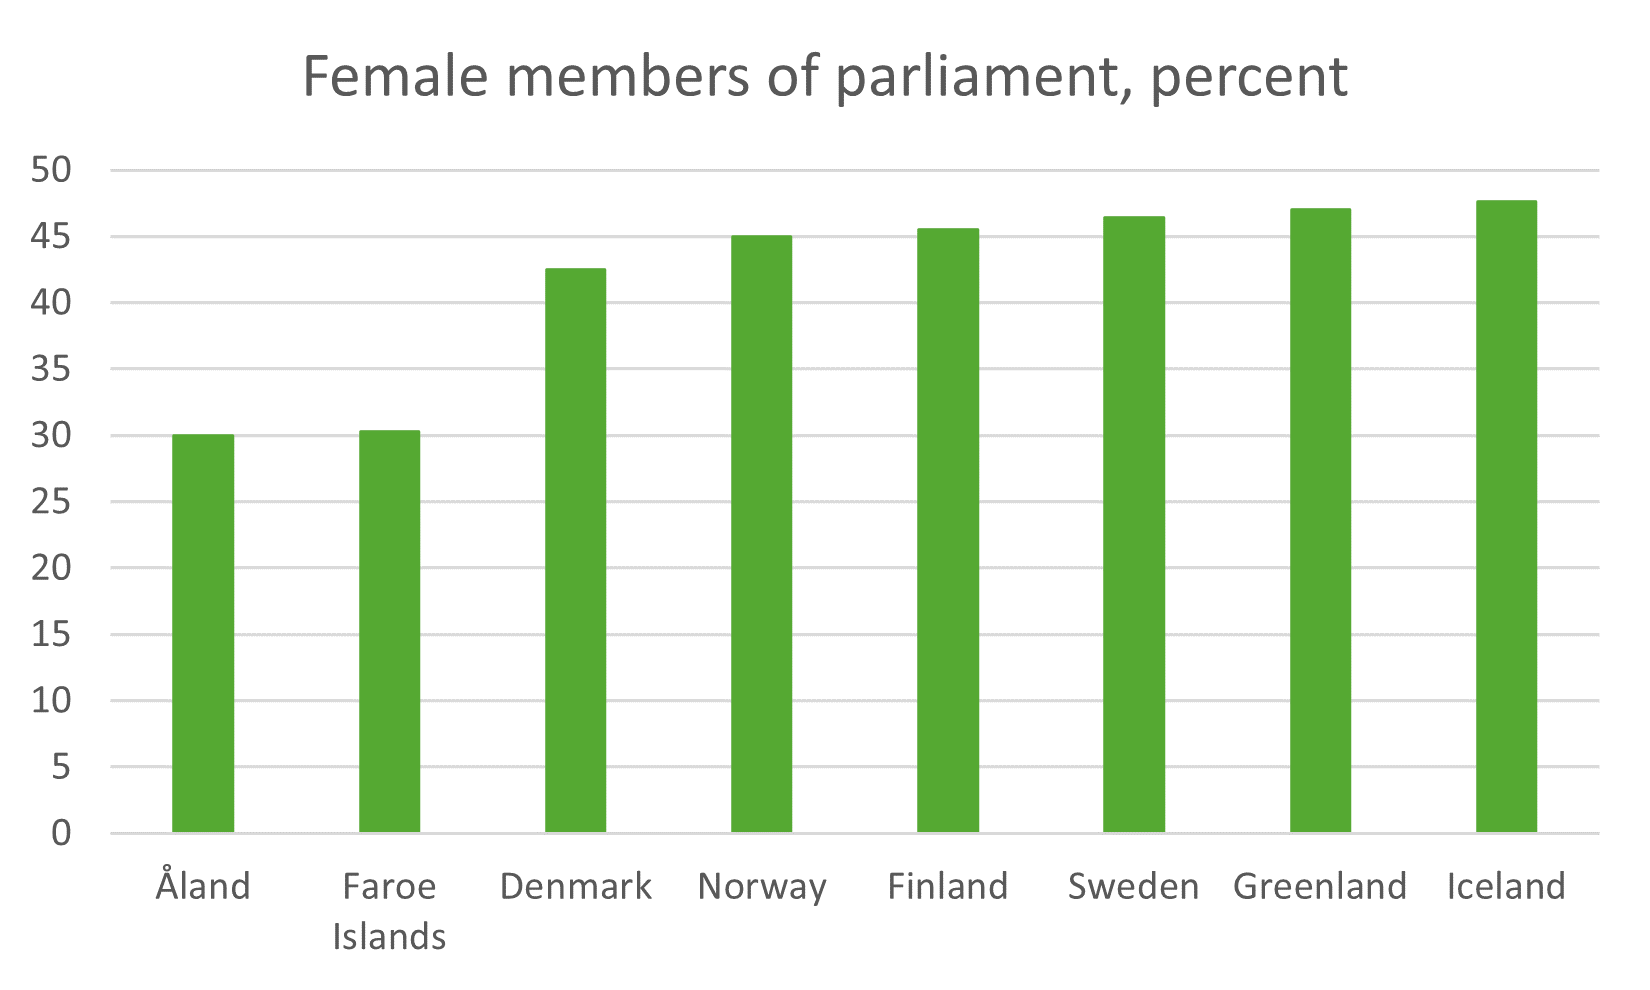
Source: Nordic Statistics Database, SOSU23: Female members of parliament by time and reporting country
Economic inequality
Reducing economic inequality is essential for sustaining a healthy democracy, as it ensures that everyone has a fair chance to participate and benefit from the political process. The Gini coefficient is the most commonly used measure of income inequality within a society. It ranges from 0 to 1, with 0 indicating perfect equality and 1 representing extreme inequality. The lower the Gini coefficient, the more equitable the distribution of income.
The Nordic countries have had an average Gini coefficient of between 0,25 and 0,27 since 2010. For reference, the EU as a whole has had a value of 0,3 or just over during the same period. The difference between the regions have decreased over time, with the exception of 2021 where they developed in different directions. Whether this is temporary (and possibly an effect of the Covid-19 pandemic) or the beginning of new trends, remains to be seen.
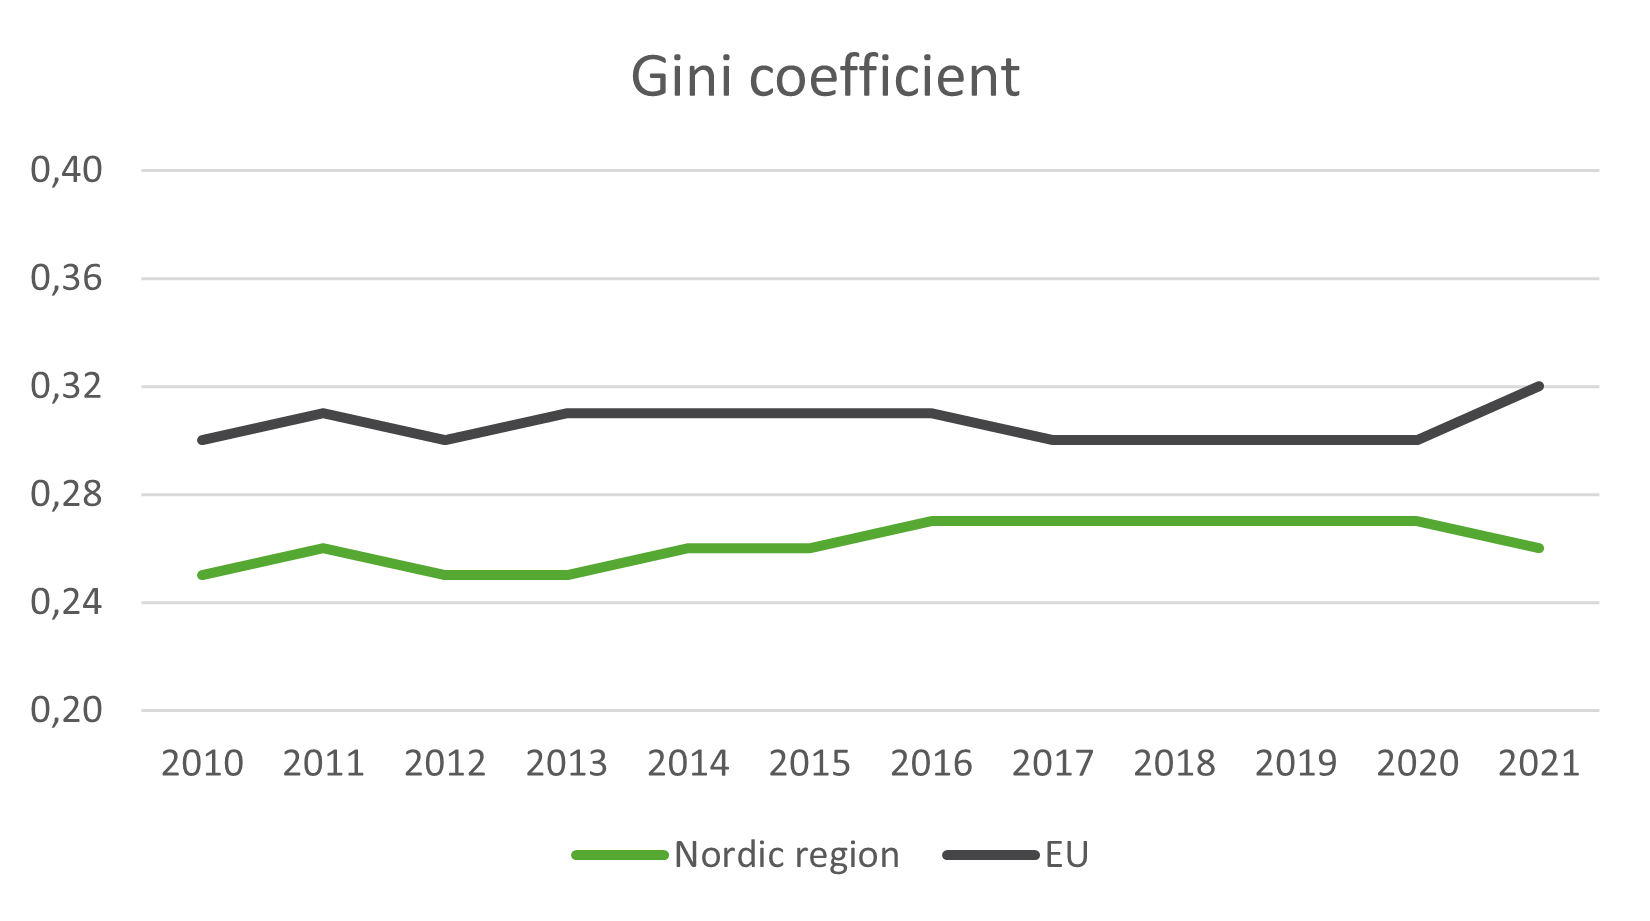
Source: Nordic Statistics Database, GINI01: Gini coefficient by time and reporting country (EU)
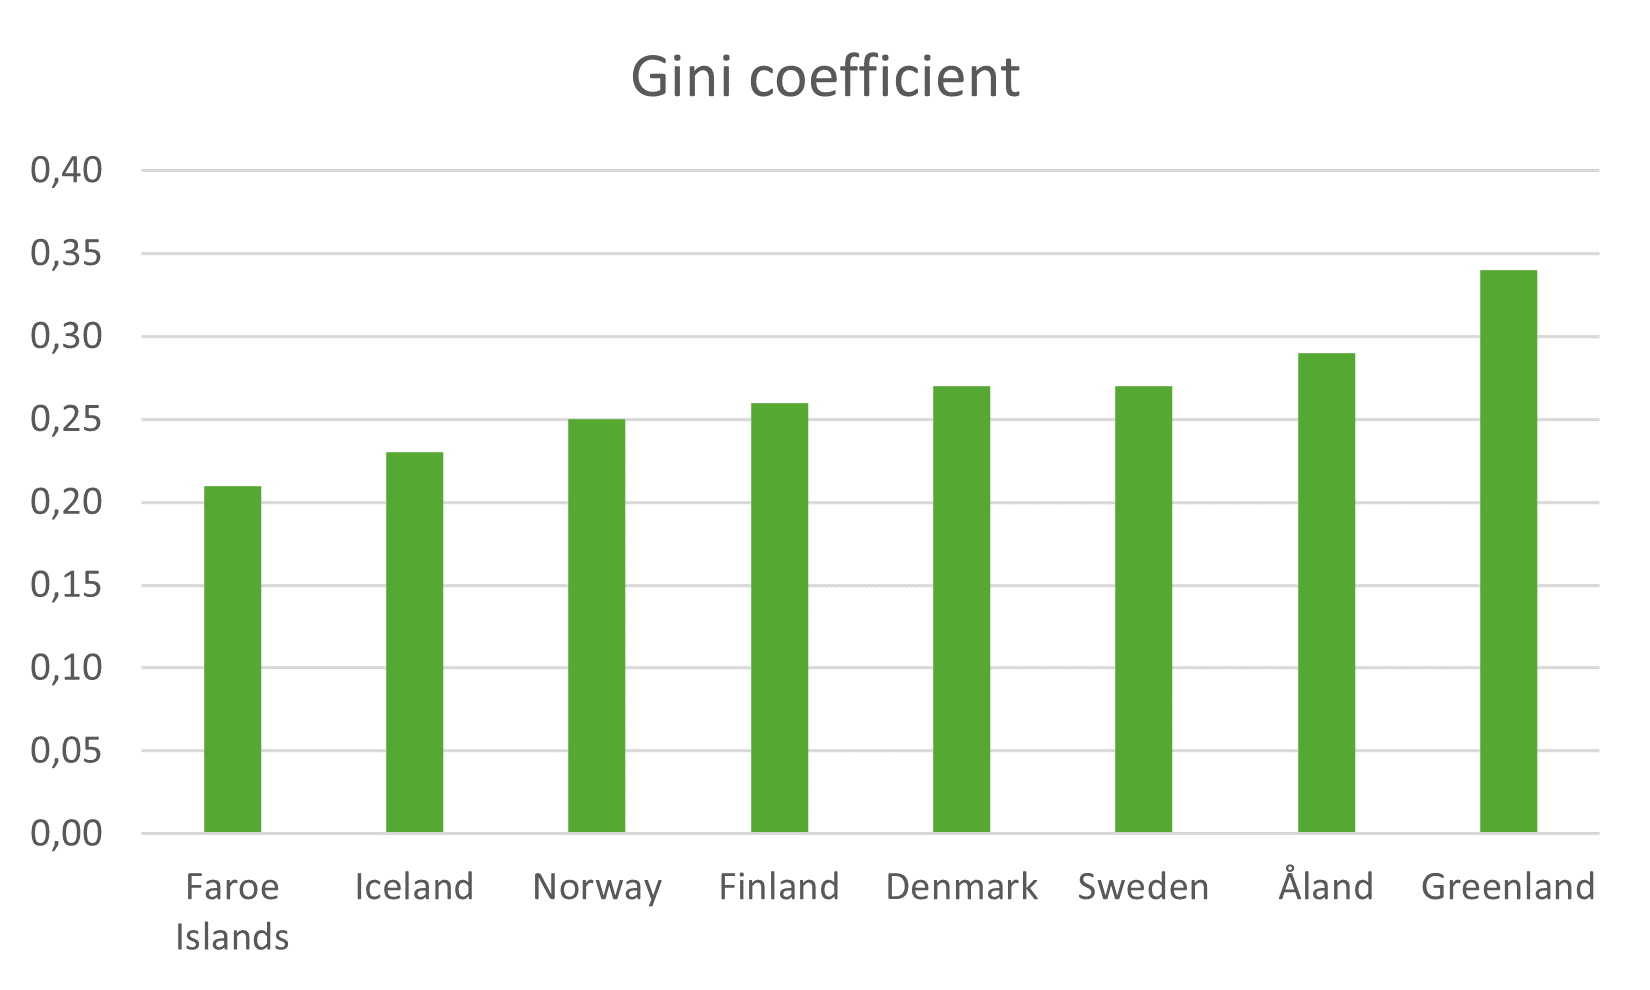
Nordic Statistics Database, SOSU31: Economic inequality (Gini coefficient) by reporting country and time (Nordic region)
The latest observed Gini coefficient varies between most equal in the Faroe Islands and least equal in Greenland.
[2] https://www.idea.int/sites/default/files/publications/voter-turnout-trends-around-the-world.pdf, page 24